使用 Helm 安装 Prometheus Stack
前置条件:
安装 Prometheus
添加 Prometheus chart repo 到 Helm
helm repo add prometheus-community https://prometheus-community.github.io/helm-charts
helm repo update
查看版本信息
helm search repo prometheus-community/kube-prometheus-stack
NAME                                            CHART VERSION   APP VERSION     DESCRIPTION
prometheus-community/kube-prometheus-stack      46.4.1          v0.65.1         ...
编写或修改配置文件。
## values.yaml
prometheus:
  prometheusSpec:
    podMonitorSelectorNilUsesHelmValues: false
    serviceMonitorSelectorNilUsesHelmValues: false
运行以下命令安装 Prometheus
helm install prometheus prometheus-community/kube-prometheus-stack --namespace prometheus --create-namespace -f values.yaml
或指定 helm-chart 版本
helm install prometheus prometheus-community/kube-prometheus-stack --namespace prometheus --create-namespace -f values.yaml --version 46.4.1
等待安装完成
kubectl wait --for=condition=Ready pods --all -n prometheus --timeout=300s

# pod/alertmanager-prometheus-kube-prometheus-alertmanager-0 condition met
# pod/prometheus-kube-prometheus-operator-68d75d48f7-46vfz condition met
# pod/prometheus-kube-state-metrics-5fc6f4c67d-mdmgk condition met
# pod/prometheus-prometheus-kube-prometheus-prometheus-0 condition met
# pod/prometheus-prometheus-node-exporter-2d5b4 condition met
# pod/prometheus-prometheus-node-exporter-6pbr7 condition met
# pod/prometheus-prometheus-node-exporter-wpxx4 condition met
如果需要更改配置,可运行
helm upgrade prometheus prometheus-community/kube-prometheus-stack --namespace prometheus -f values.yaml
或者卸载重来
helm uninstall prometheus -n prometheus

# 以下可选
kubectl delete crd alertmanagerconfigs.monitoring.coreos.com
kubectl delete crd alertmanagers.monitoring.coreos.com
kubectl delete crd podmonitors.monitoring.coreos.com
kubectl delete crd probes.monitoring.coreos.com
kubectl delete crd prometheuses.monitoring.coreos.com
kubectl delete crd prometheusrules.monitoring.coreos.com
kubectl delete crd servicemonitors.monitoring.coreos.com
kubectl delete crd thanosrulers.monitoring.coreos.com
配置 Grafana 域名和证书
kubectl apply -f grafana-ingress.yaml
# grafana-ingress.yaml
apiVersion: networking.k8s.io/v1
kind: Ingress
metadata:
  name: grafana
  namespace: prometheus
  annotations:
    cert-manager.io/cluster-issuer: letsencrypt-dns01 # 配置自动生成 https 证书
    kubernetes.io/ingress.class: nginx
spec:
  tls:
    - hosts:
        - 'grafana.todoit.tech'
      secretName: grafana-letsencrypt-tls
  rules:
    - host: grafana.todoit.tech
      http:
        paths:
          - path: /
            pathType: Prefix
            backend:
              service:
                name: prometheus-grafana
                port:
                  number: 3000
等待 HTTPS 证书签发完成
kubectl get certificate -n prometheu -w
# NAME                      READY   SECRET                    AGE
# grafana-letsencrypt-tls   True    grafana-letsencrypt-tls   80s
访问 Grafana
使用 SwitchHosts 来做域名映射
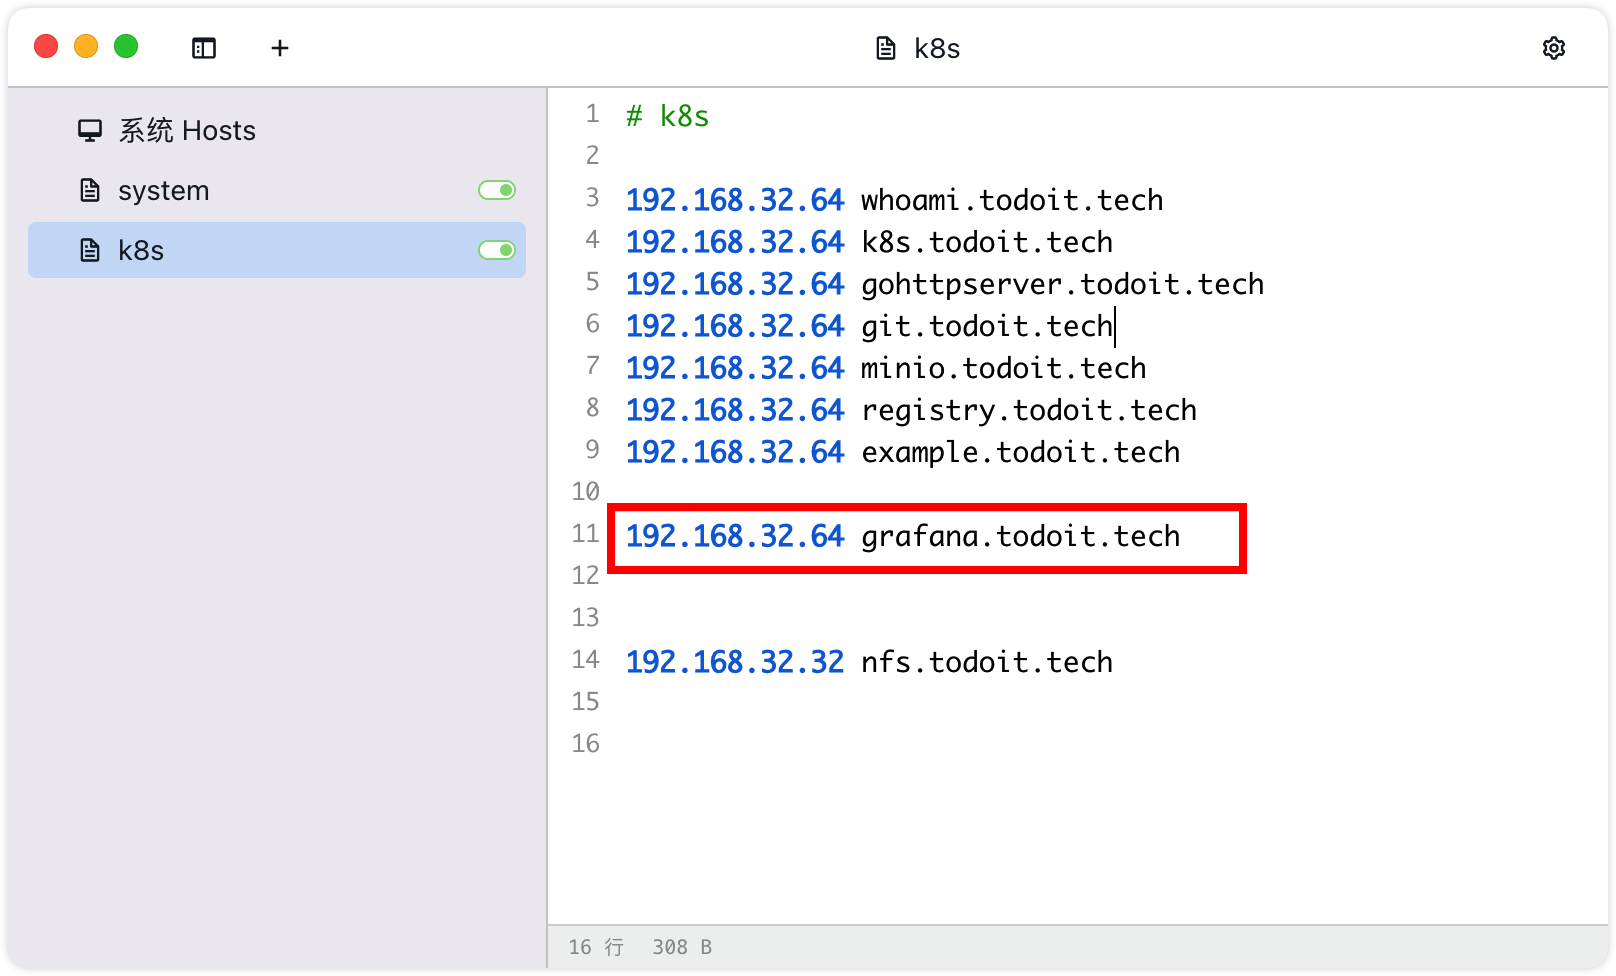
现在,可以使用以下域名访问 Grafana 了
用户名是 admin,密码可通过以下命令获取
kubectl get secret --namespace prometheus prometheus-grafana -o jsonpath="{.data.admin-password}" | base64 --decode ; echo;
# prom-operator
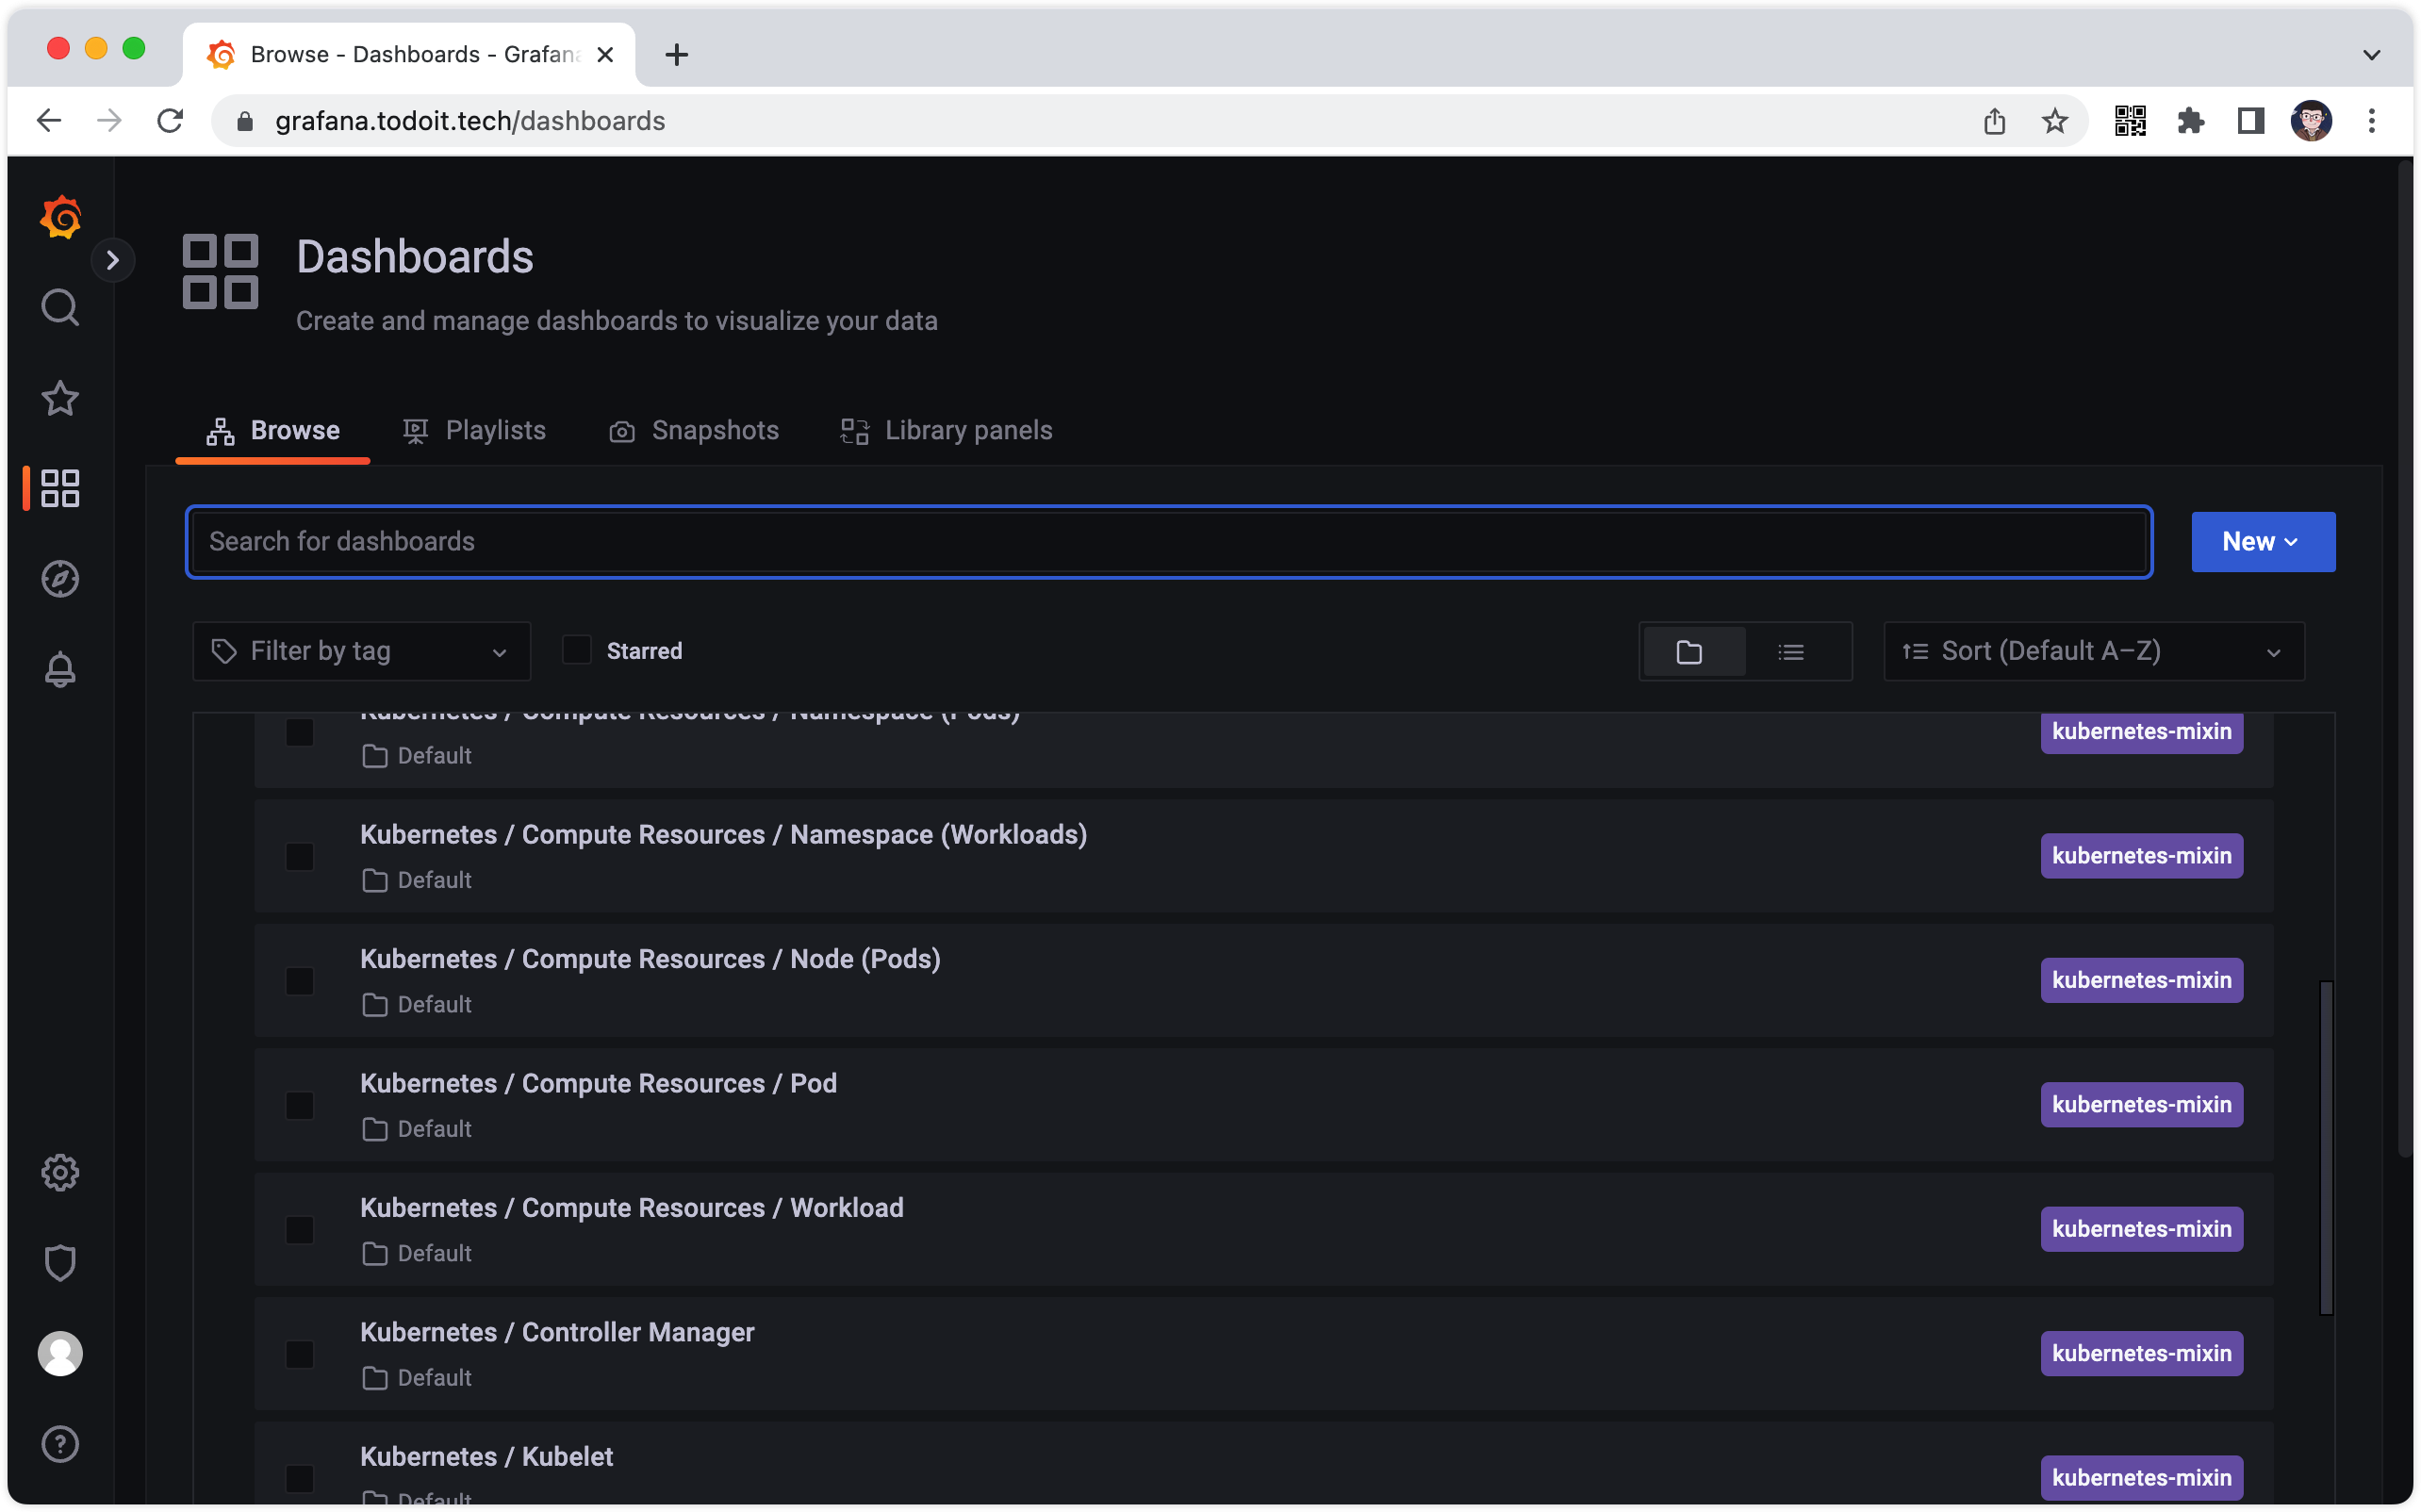
Grafana 内部预置了很多强大易用的仪表盘,可以在左侧菜单栏的“Dashboards - Browse”里任意挑选一个:
配置 Prometheus 采集 Ingress-Nginx 指标
我们也可以使用社区现成的 Dashboard 来建立指标监控体系,譬如 Ingress-Nginx 核心指标 Dashboard。
点击左侧 Dashboard 模块,选择 Import 导入面板。
然后在 Import via grafana.com 中输入 9614,点击 Load,选择 prometheus 数据源,点击 Import 即可。
不过现在获取不到任何数据。
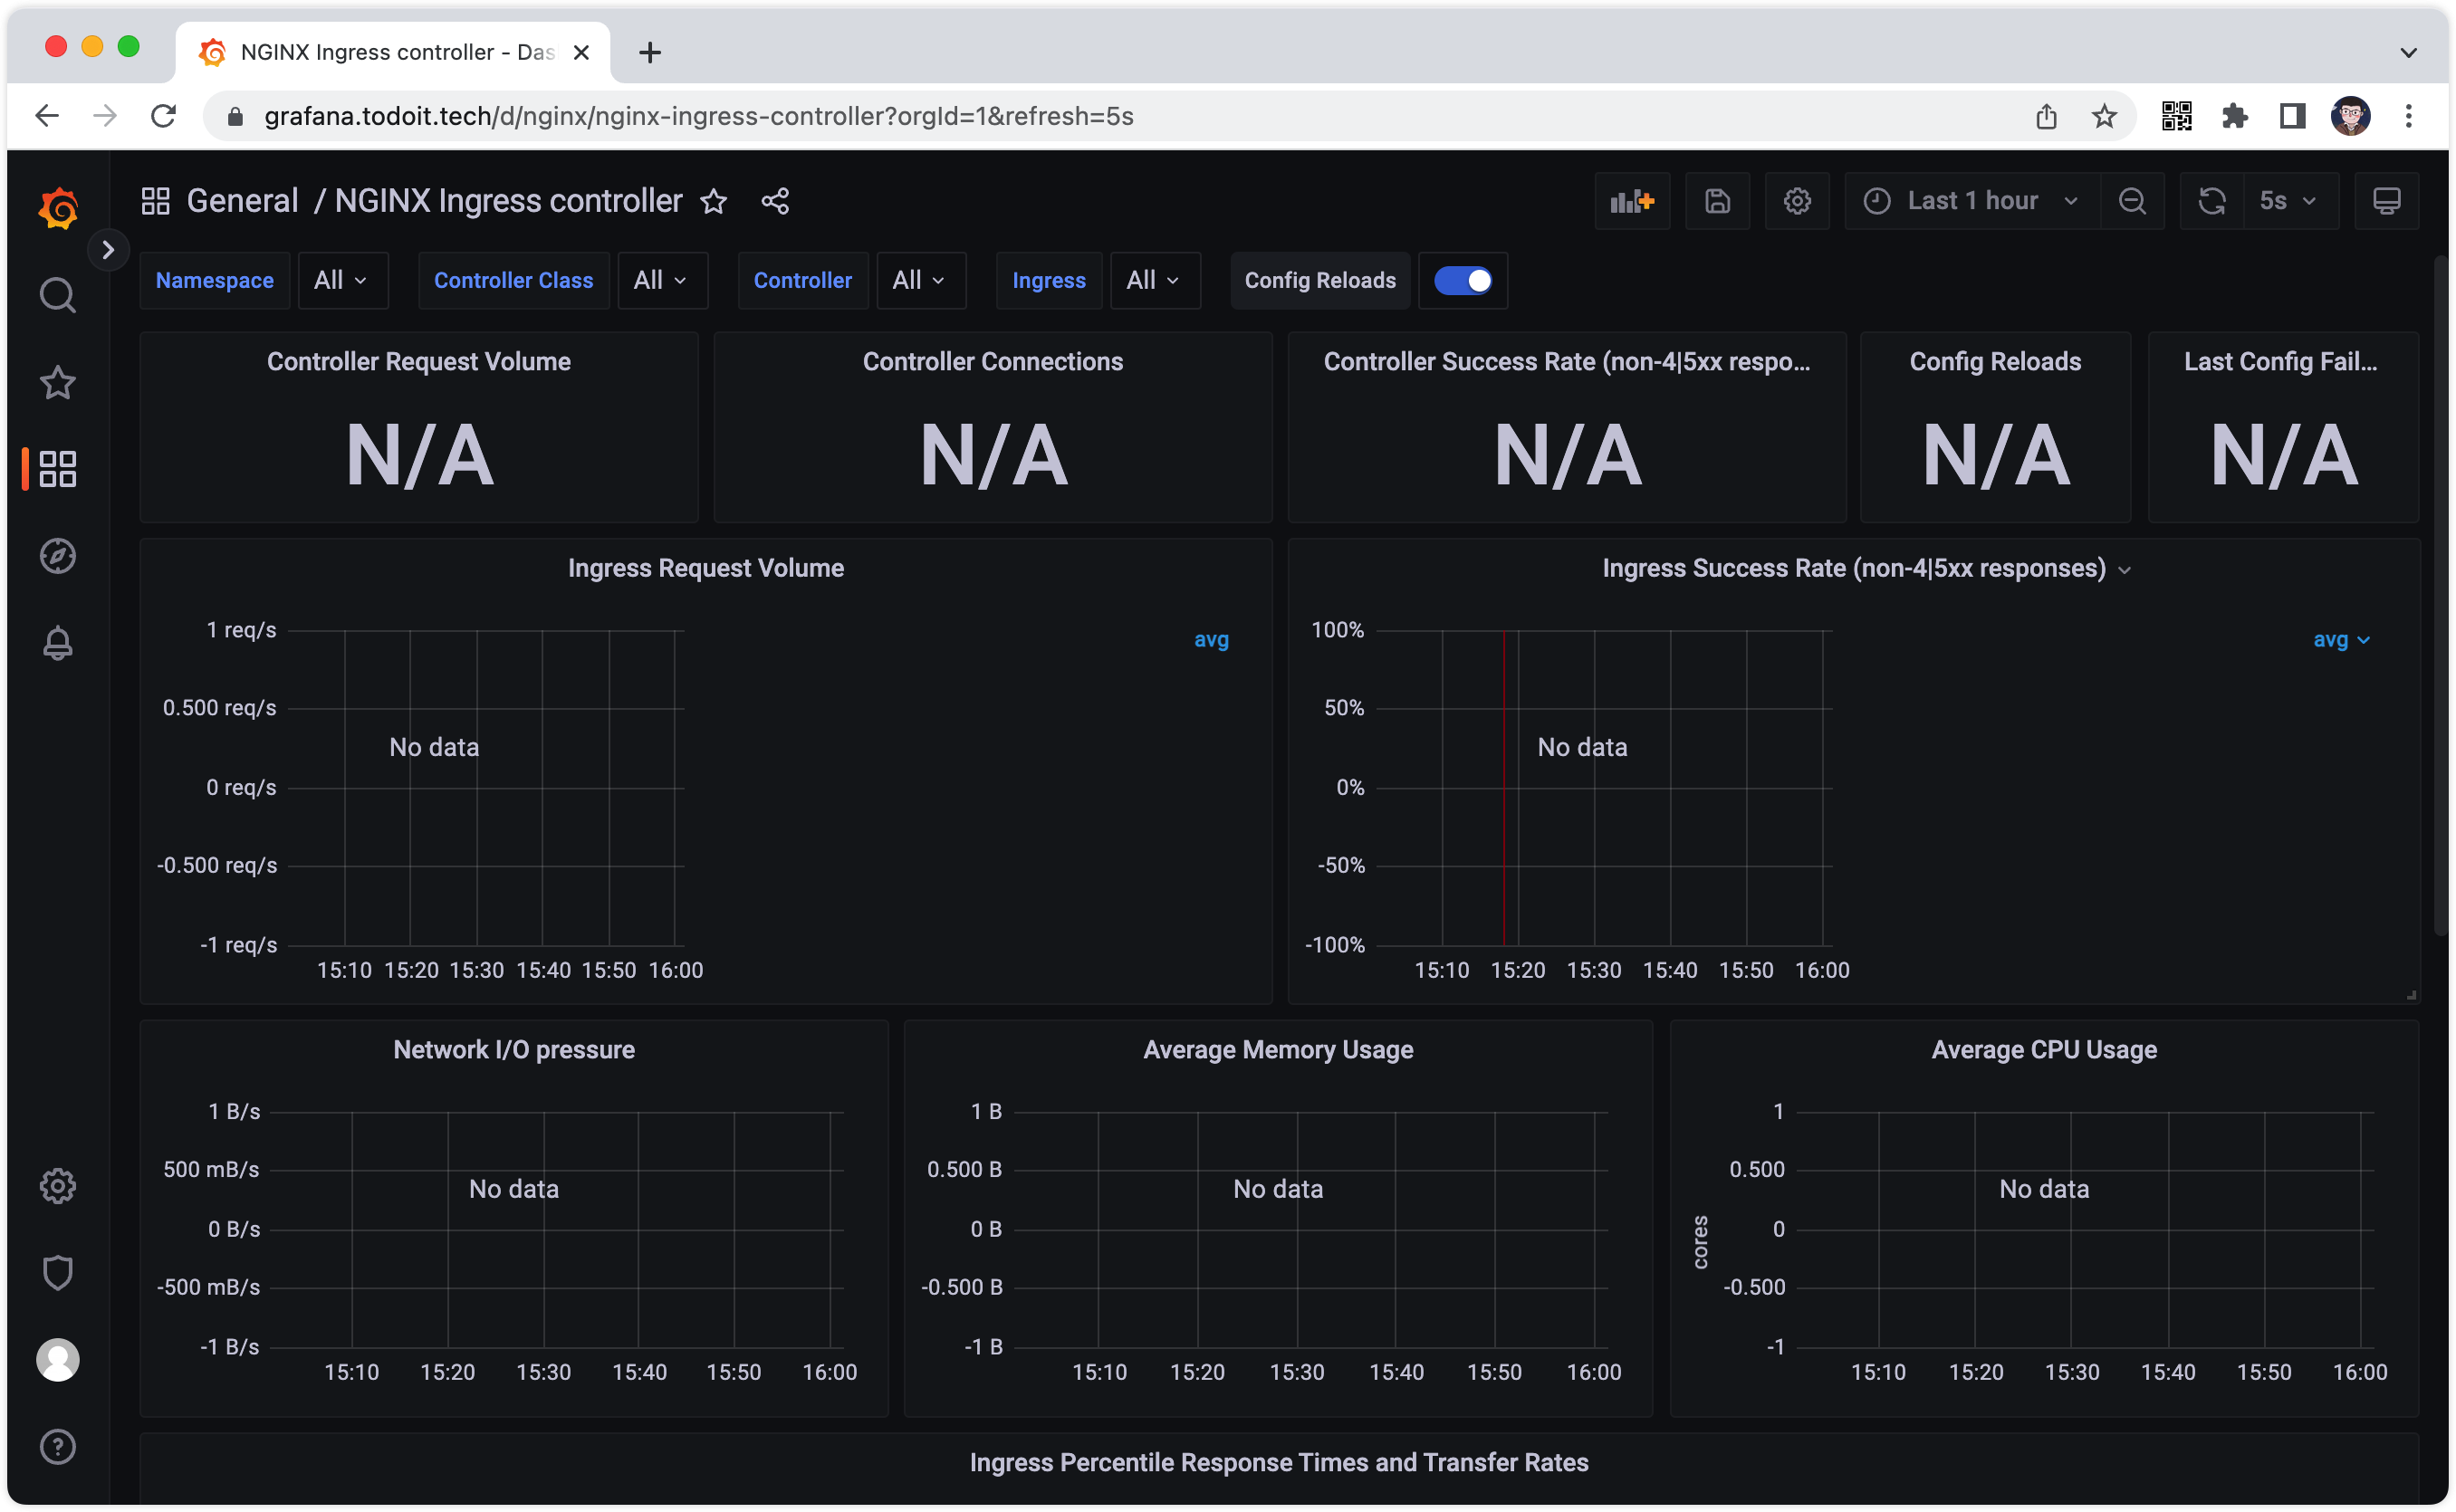
我们需要更新 ingress-nginx 的配置,让其暴露指标数据。
ingress-nginx 的安装请参考这里
首先,修改 ingress-nginx 的配置文件,如下
# nginx/values.yaml
controller:
  metrics:
    enabled: true
    serviceMonitor:
      enabled: true
      additionalLabels:
        release: prometheus
然后更新 ingress-nginx
# 在 nginx/values.yaml 所在目录下执行
helm upgrade ingress-nginx ingress-nginx/ingress-nginx -n ingress-nginx -f ./values.yaml --version 4.5.2
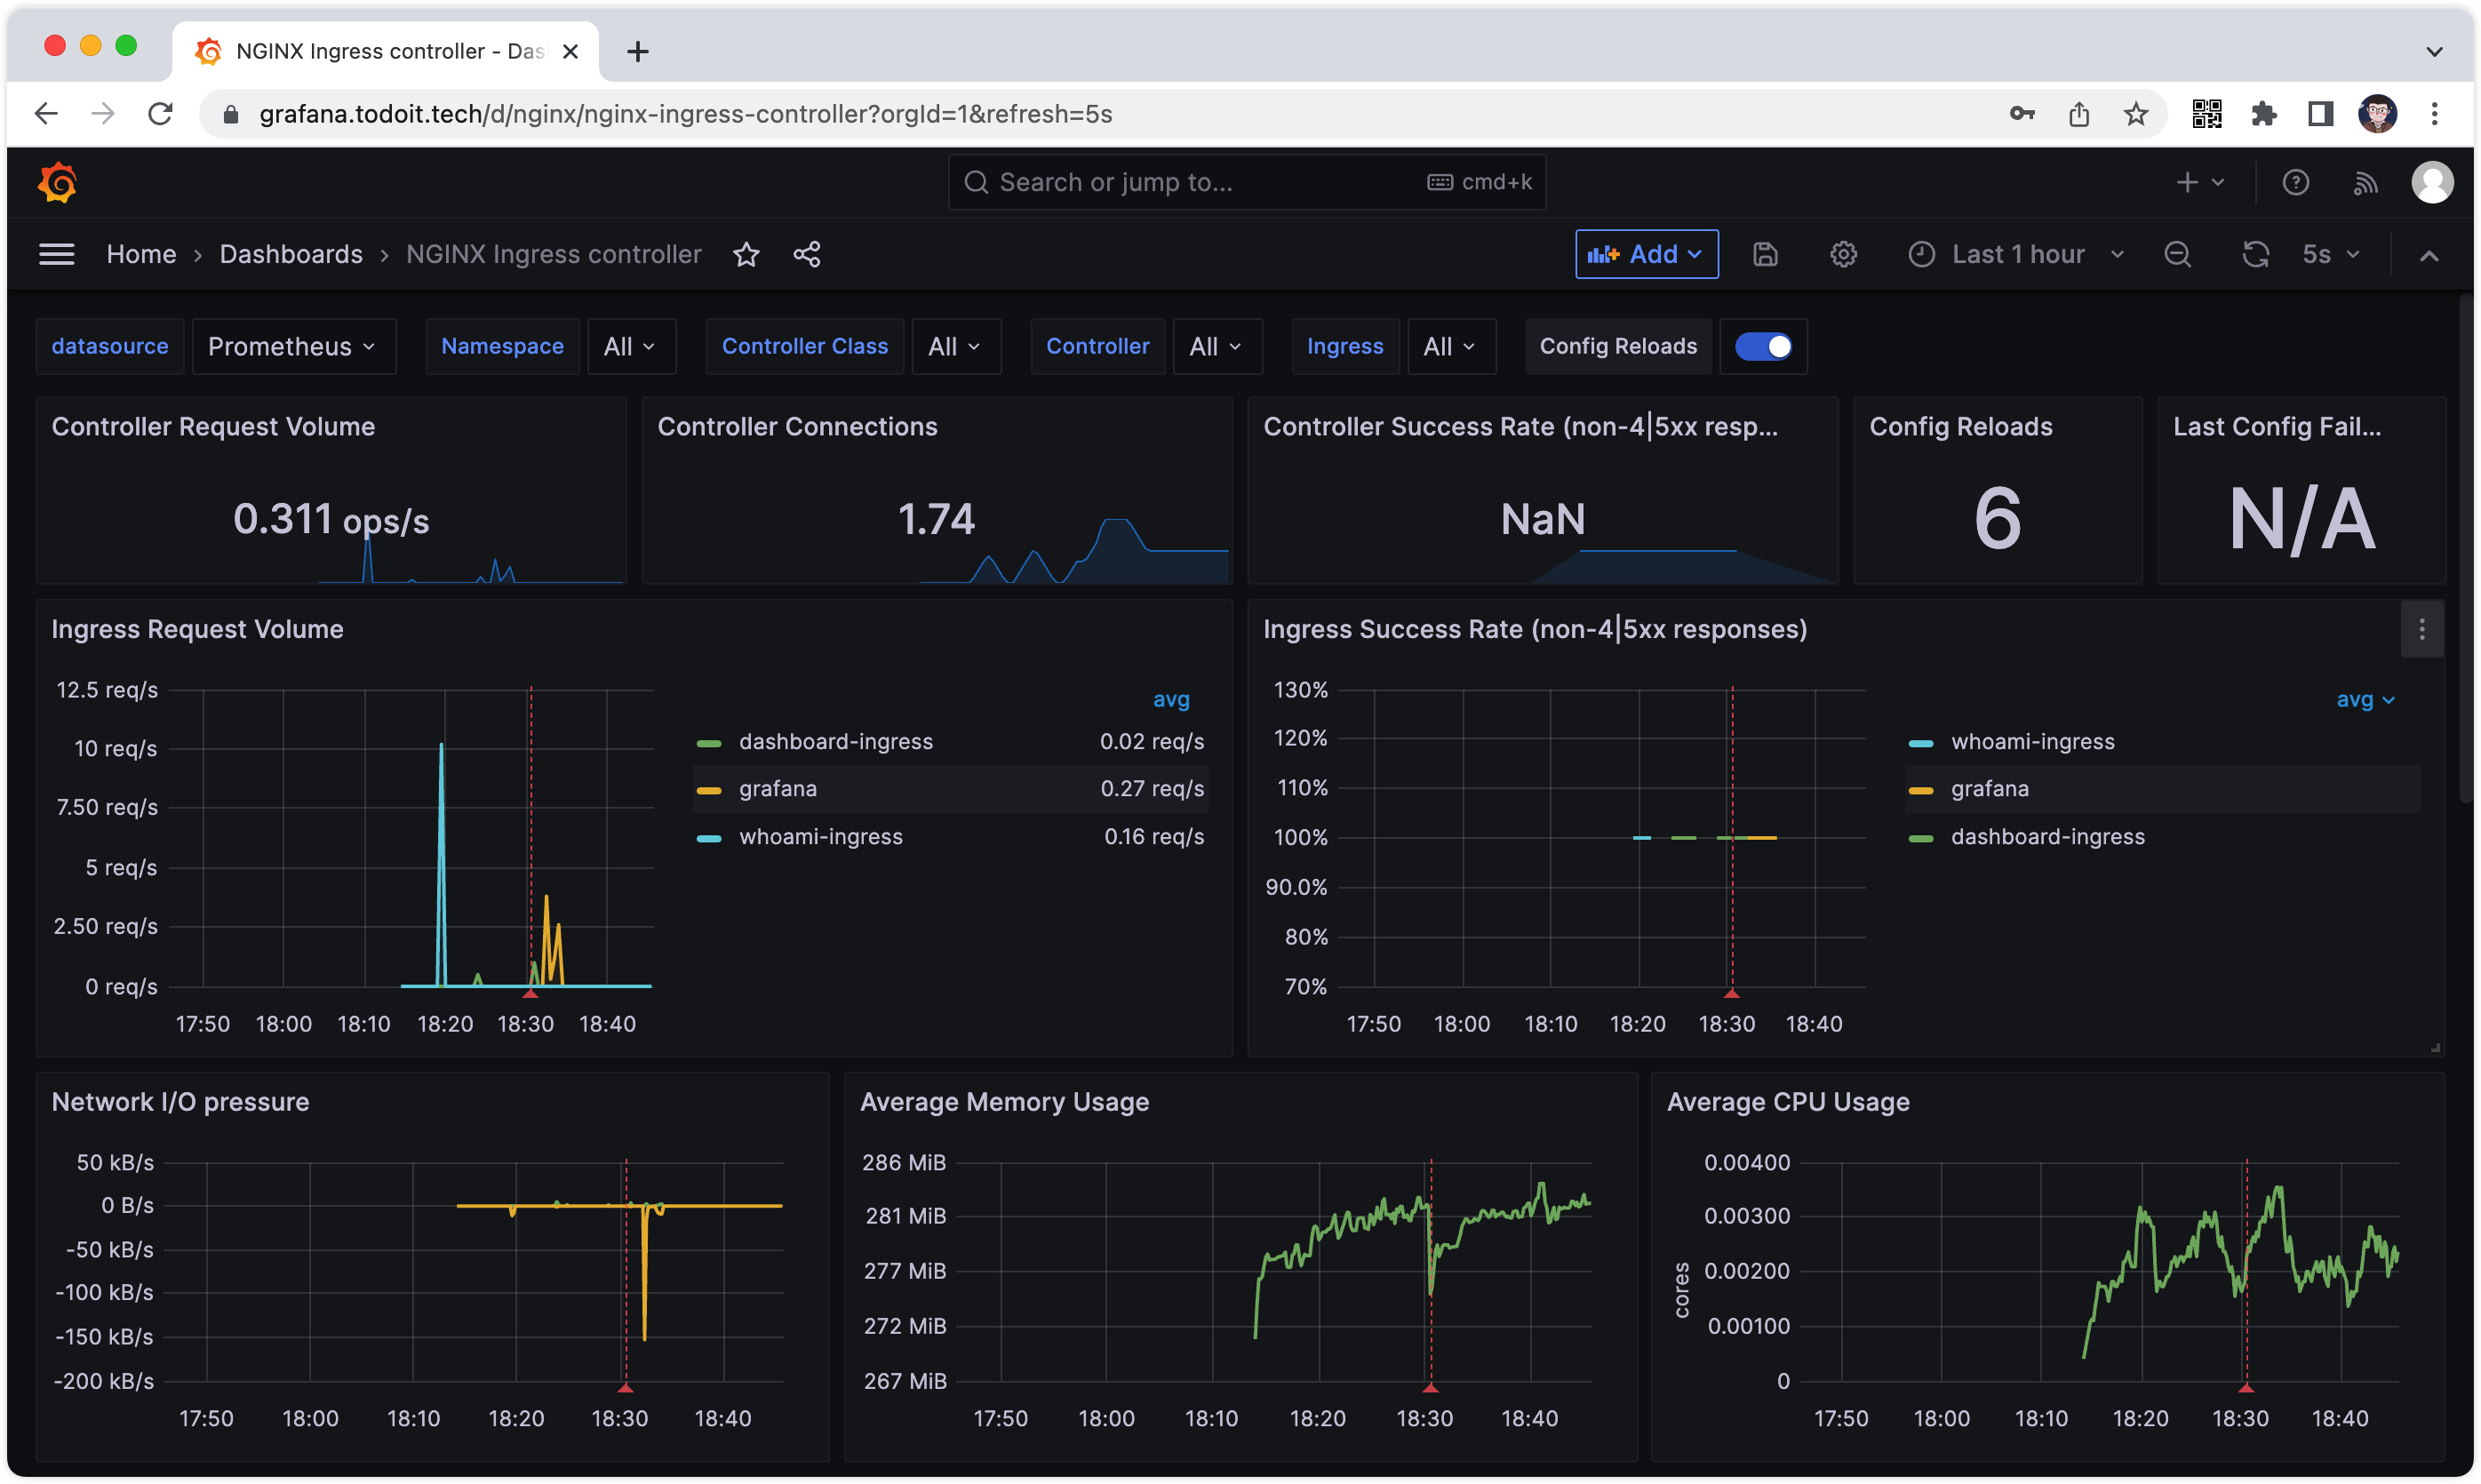
现在应该能收集到 Ingress-Nginx 的指标数据了。
参考